Boosting Basket Size via Predictive Analysis
November 3, 2020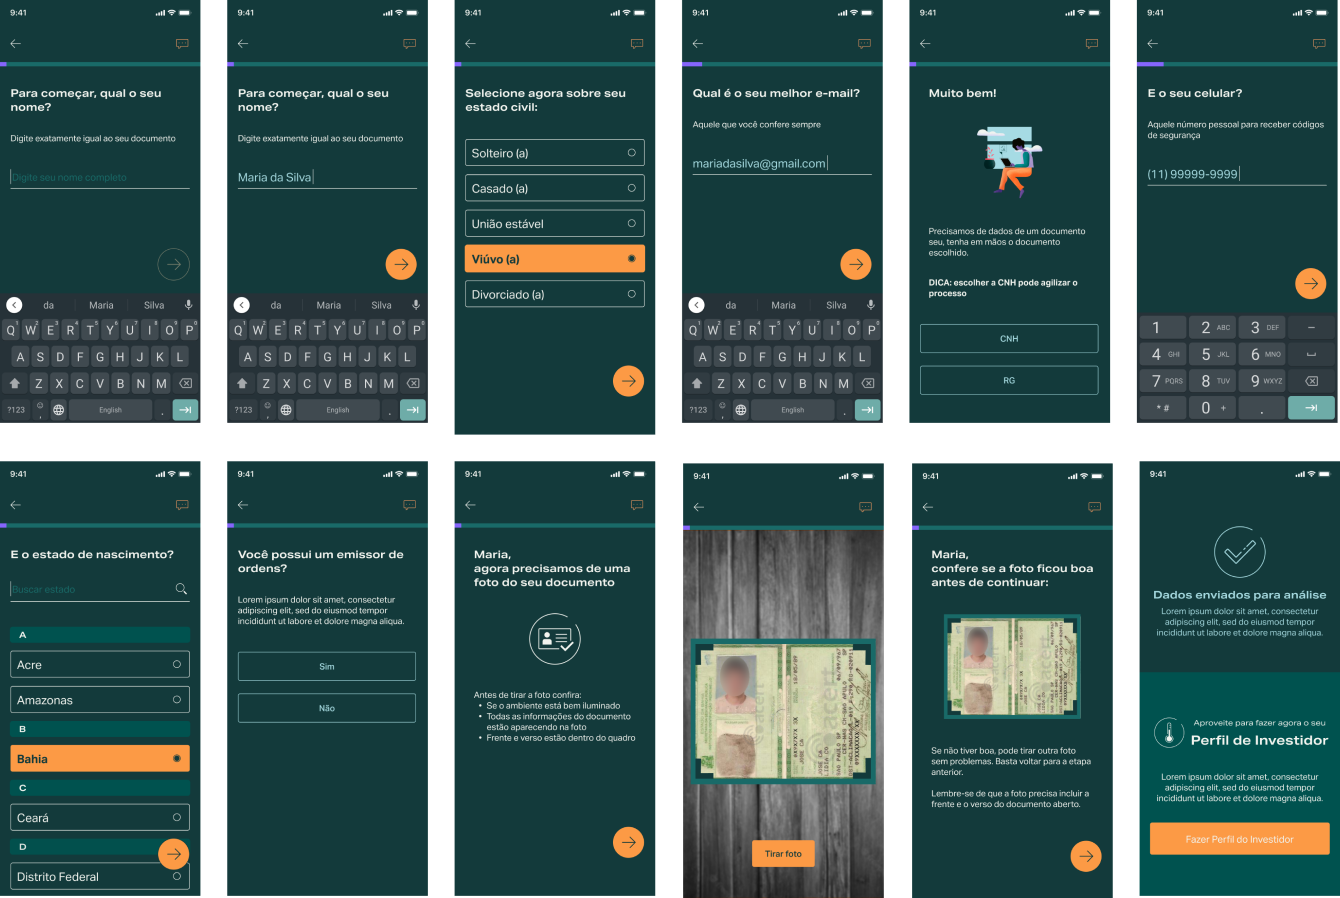
Transforming a Web-View Onboarding into a Native Mobile Experience
March 15, 2026Tasks
Project management, Research, UX, UI, User-testing, Developer hand-over
Tools
Miro, in-person workshop
The Mission
Align cross-functional global teams (South America & South Asia) on product priorities by visualizing the complete buyer journey and its pain points.
The Core Challenge
High demand from multiple departments was creating misalignment on product roadmaps. Stakeholders lacked a unified understanding of the user’s true pain points.
Result
Developed a weighted prioritization system and a "360-degree" Blueprint that transformed stakeholder "demands" into a collaborative, data-driven roadmap.
The Data Foundation (Cross-Data Analysis)
To create a baseline of truth, I synthesized thousands of data points from diverse sources:
-
Social Listening: Reviews from App Stores and social media sentiment.
-
Direct Support: Analyzing the high-volume ticket backlog from the Customer Support team.
-
Sentiment Metrics: Reading and categorizing all qualitative feedback from NPS surveys.
The Filter: My team developed a Weighted Prioritization Matrix. We assigned values based on business impact and user pain—financial loss for the user or the company, for example, would triple the severity score of a pain point.
| Prioritization Layer | Data Input | Outcome |
|---|---|---|
| Weighted Scoring | Business Impact x User Pain (e.g., Financial loss). | Isolated the Top 30 most critical pain points from thousands of inputs. |
| Buyer Feedback | NPS commentaries and Support tickets. | Humanized the data for stakeholders, building empathy for the user's struggle. |
| Impact-Effort Matrix | Stakeholder ideas vs. Development feasibility. | Created a transparent, agreed-upon roadmap for the upcoming quarters. |
The Blueprint: A Strategic Tool
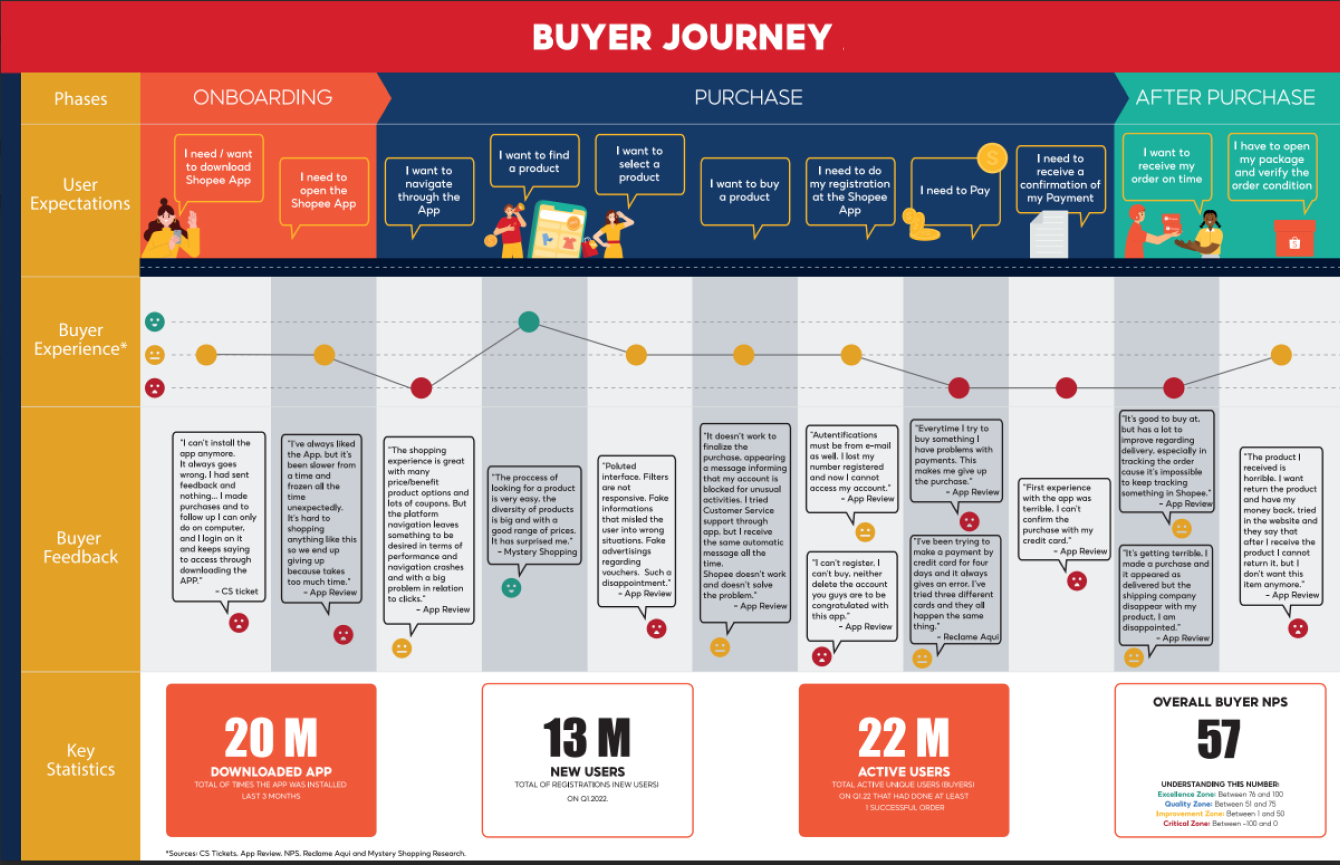
I designed a comprehensive Service Blueprint to serve as the "North Star" for the internal brainstorming event. This wasn't just a map; it was a decision-making framework divided into three core phases: Onboarding, Purchase, and After-Purchase.
| Blueprint Layer | Description | Strategic Value |
|---|---|---|
| User Journey Phases | Categorized into Onboarding, Purchase, and After-Purchase. | Helped stakeholders see the "big picture" beyond their specific department silos. |
| Expectations vs. Reality | Mapped user goals against the current performance ratings. | Highlighted the "Experience Gaps" where the platform was failing user needs. |
| Quantitative Stats | General statistics, CTRs, and drop-off rates for each phase. | Provided the hard evidence needed to justify reprioritization to leadership. |
| Qualitative Feedback | Direct quotes from NPS, Support tickets, and Social Media. | Humanized the problems, making the emotional impact on the buyer undeniable. |
Final Impact & Takeaways
-
The Win: Shifted the company culture from "Feature Demands" to "Problem Solving." By involving stakeholders in the ideation process, we gained 100% buy-in for the upcoming product roadmap.
-
Business Value: Reduced friction between departments and increased trust in the Product Team’s prioritization logic. This strategic alignment ensures that engineering resources are always spent on the problems that impact the bottom line most.
-
Personal Growth: This project sharpened my ability to synthesize massive amounts of qualitative data into a visual narrative. It taught me that a Designer's most powerful tool isn't just Figma—it's the ability to empathize with both the user and the stakeholder to find a common path forward.